Project Cassandra (Machine Learning at Dots)
Cassandra was a character from Greek mythology known for her gift of prophecy. Certain versions of her story report snakes that licked her ears, whispering predictions to her as she slept. In others the Greek God Apollo bestows her with the gift of prophesy in an attempt to woo her. At Dots, instead of using serpents or divine inspiration, we use the power of machine learning to make different predictions about our users.
One of our main goals on the Dots data science team is to keep and retain our players. In Project Cassandra, we sought to take preventative measures by predicting, identifying, and incentivizing potential users who may quit our game (termed lapsers or churn) in the near future. We used the library scikit-learn in Python for this project.
We first set up our project by extracting different attributes (termed features) from our users. Examples of user features include country, type of phone (Android or iOS), app version, the number of levels completed and time since last play session. From there we picked out features that we thought would be good indicators of potential lapsers vs non-lapsers. These attributes included social network connections, money spent in game, level progression and attempt stats etc. Another issue we realized immediately after looking at the data is that the data set is unbalanced, meaning in the data set the binary outcome (lapsers vs non-lapsers) distribution is heavily skewed to non-lapsers, which might hurt the prediction accuracy. We used a resampling approach to address this issue.
Once we narrowed down the useful features, we took a sample of the population that was already pre-divided between lapsers and non-lapsers. We then used logistic regression algorithms to digest the data and the attributes. The logistic regression was able to mathematically fit the data and thus “learned” the attributes of the lapsers and non-lapsers. Once the regression algorithm was “trained” it was then able to further classify other users based off of only their features. This training/testing method is what is known as supervised learning in machine learning. By taking on and learning from several different samples of our users we were able to take an average of the logistic algorithm fit in what is known as k fold cross validation.
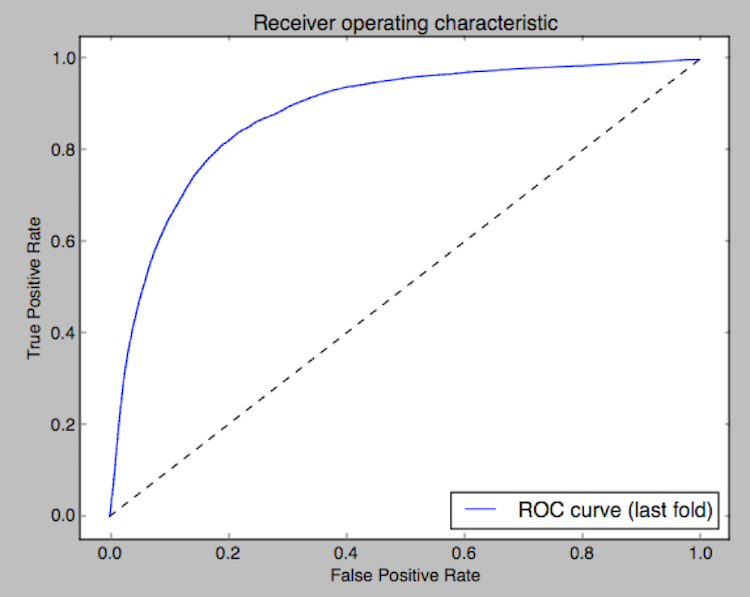
Our results when compared to actual data were promising. On a given specific day, we had about 4 people per 100 users who would not come back to the game in the next 14 days. Our logistic regression algorithm was able to determine 90% of these lapsers. On the other hand, out of the remaining non-lapsers, we were able to correctly identify 96% of them. As with all machine learning classification algorithms, we typically have errors in the form of false positives (4% non-lapsers classified as lapsers) and also false negatives (missed 10% lapsers classified as non-lapsers). In this particular case, we prefer sensitivity to specificity, because we want to capture as many real lapsers as possible despite the inevitable cost of involving some false positives. The ROC (Receiver Operating Characteristic) curve below also describes the fitness of the model.

After we are able to identify lapsers with reliable accuracy, the next step is to work with the product team to figure out the best channel to reach out to players so that we can prevent them churning. It can be an in-app message, or push notification with relevant content, or even an email. Ultimately, we hope to use our prediction to put forth better and smarter products.